BrokerHiveXBrokerHiveXBrokerHiveX
Summary:Technical analysis is a core method in forex trading. This article details candlestick patterns, trend lines and channels, support and resistance, common indicators, and the development of a complete trading system. It also incorporates practical examples, risk management, and psychological discipline to help traders build a replicable, long-term profit model.
The forex market operates 24/7, with massive trading volumes and extremely high liquidity. While fundamentals determine long-term direction, technical analysis is the only accurate tool for traders to enter and exit the market .
Technical analysis reveals market psychology through price and volume.
Support and resistance, trend lines, and indicators can transform chaotic market conditions into actionable patterns.
Without technical analysis, traders often cannot find reasonable entry and exit points.
Real case: In 2019, EUR/USD fell from 1.15 to 1.09. The fundamental explanation was "weak eurozone + strong dollar", but the key breakthrough point of technical analysis (the 1.1300 support level was broken) was the real entry signal .
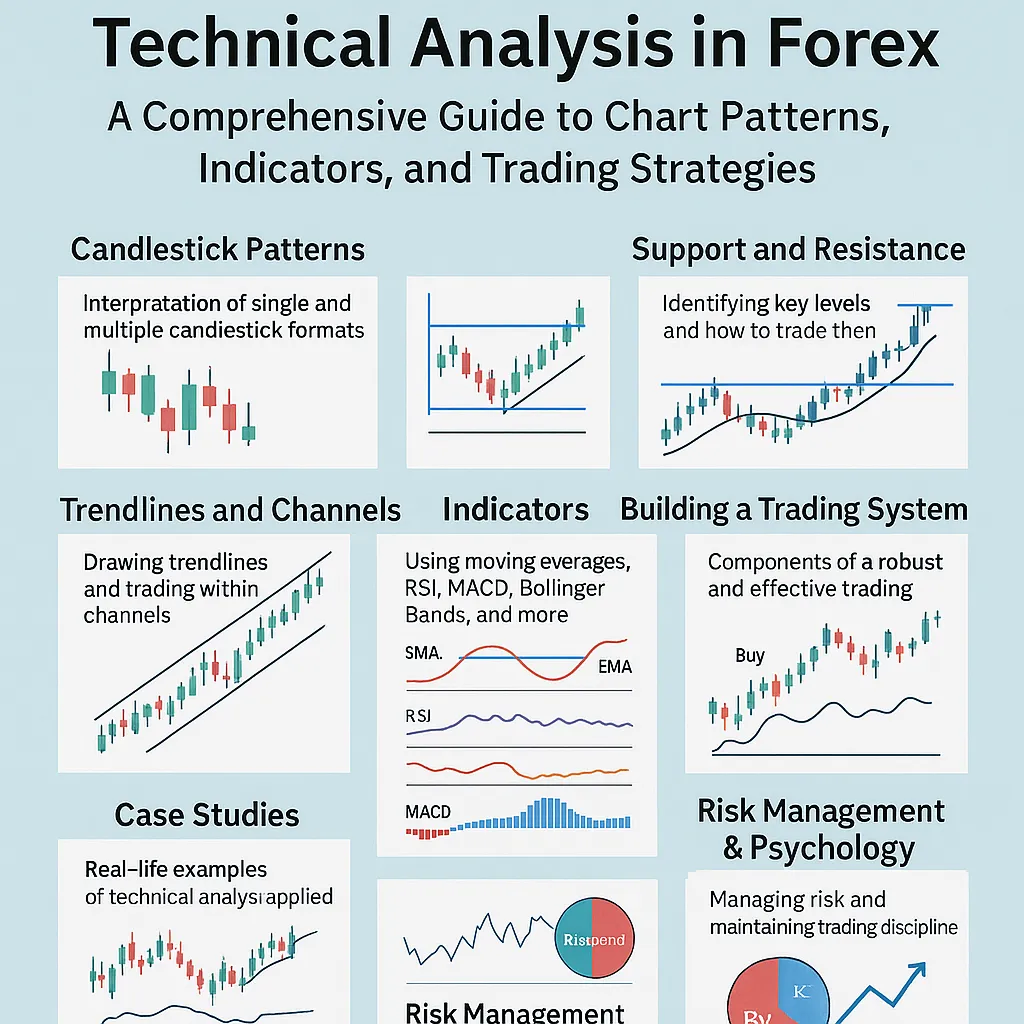
Hammer : A long lower shadow indicates a strong buying counterattack, often seen at the bottom.
Shooting Star : The upper shadow line is long, showing the strength of the bears, and is often seen at the top.
Long white candlestick/long black candlestick : trend continuation signal.
Case: During the 2020 pandemic crash, USD/JPY formed a typical hammer line near 101, and then started a rebound.
Engulfing : A reversal signal that often appears at the end of a trend.
Harami : The trend may weaken.
Morning/Evening Star : A strong reversal signal.
Practical advice: K-line patterns must be used in combination with support and resistance. The winning rate of using them alone is limited.
Support : A level where buying is likely to emerge when prices fall.
Resistance : A level where selling is likely to increase as prices rise.
Historical highs and lows.
Round numbers (1.1000 for EUR/USD, 150.00 for USD/JPY).
Moving average.
Fibonacci retracement.
In 2017, USD/JPY repeatedly found support at 108, eventually forming a bottom structure, and then rose to 114. Support and resistance reflect the consensus of market funds.
Uptrend: Connect two or more low points.
Downtrend: Connect two or more high points.
The steeper the trend line angle, the more unstable it is.
Parallel channel: Price oscillates between support and resistance.
Oblique channel: prices move in line with the trend.
Traders can buy low and sell high in a trend channel, or follow the trend when there is a breakout.
Simple Moving Average (SMA) : Smoothes price movements.
Exponential Moving Average (EMA) : More sensitive to recent prices.
Golden Cross/Death Cross : Long-term trend signal.
Fast/slow line crossover : trend reversal.
Histogram zoom : trend strengthening.
Overbought > 70, oversold < 30.
Divergence signals are common in trend reversals.
Narrowing: The market is about to explode.
Breakout: May start a trend.
Measuring volatility for use in setting stop-loss orders.
Real-world experience: Indicators are not prediction tools, but auxiliary confirmation tools. Avoid relying on a single indicator.
Head and Shoulders Top/Bottom : A classic reversal pattern.
Double top/double bottom : price reversal signal.
Triangle consolidation : breakthrough means trend continuation.
Flag/Wedge : A pause in a trend.
Case: In 2018, EUR/USD formed a head and shoulders pattern and quickly dropped 400 points after breaking through the neckline.
The trend direction is clear.
The indicator resonates with the K-line pattern.
Support/resistance levels provide reasonable stop losses.
Single risk ≤2%.
Use ATR to determine stop loss distance.
Fixed take profit: risk-return ratio 1:2.
Trailing Take Profit: retain profit.
Take profits in batches: reduce the risk of drawdown.
The US dollar strengthened in 2021, and EUR/USD fell below the key support level of 1.2000.
Technical signals: MA death cross + MACD death cross.
Entry: short at 1.1980, stop loss at 1.2100, take profit at 1.1700.
Result: The market reached the target and the profit was 280 points.
Due to the impact of the epidemic in 2020, GBP/USD plummeted to 1.1400.
K-line signal: hammer line + RSI oversold divergence.
Entry: long order at 1.1500, stop loss at 1.1350.
Exit: 1.2000, profit 500 points.
Greed : chasing highs after a breakout without setting a stop loss.
Fear : Closing out as soon as support is reached and missing out on the market.
Discipline : Technical analysis must be accompanied by strict implementation.
Psychological Tools:
Write down your trading plan.
Daily review errors.
Accepting losses is a cost of doing business.
The risk per order is ≤2%.
Maximum drawdown ≤20%.
Monthly/weekly charts: determine long-term trends.
Daily line: Determine the main direction.
4H/1H: Execute entry point.
Example: Under the bullish trend on the daily chart, the pullback on the 1-hour chart provides a perfect buying opportunity.
AI pattern recognition : automatically scan K-line and patterns.
Big data indicator optimization : Select the best indicator parameters based on historical performance.
Quantitative trading : converting technical analysis into algorithmic rules.
Technical analysis is the forex trader's "map and compass".
K-line language reveals market psychology.
Trends and indicators provide an operational framework.
Risk control and psychology ensure long-term survival.
👉 Technical analysis is not about predicting the future, but about building a probabilistic advantage .
Q1: Which indicator should a novice learn?
A1: Moving average, simple and intuitive.
Q2: Can technical analysis guarantee profits?
A2: No, but it can provide a probabilistic advantage.
Q3: How to avoid the abuse of indicators?
A3: Use a maximum of 2-3 indicators to avoid over-complication
BrokerHivex is a financial media platform that displays information sourced from the public internet or uploaded by users. BrokerHivex does not endorse any trading platform or instrument. We are not responsible for any trading disputes or losses arising from the use of this information. Please note that the information displayed on the platform may be delayed, and users should independently verify its accuracy.